Linux - Resource Monitoring
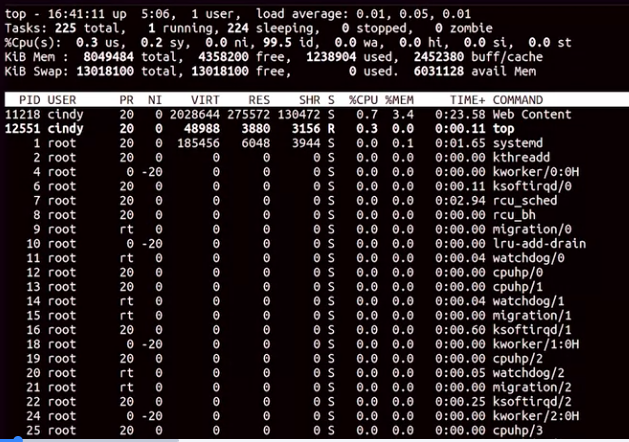
A useful command to find out what your system utilization looks like in real time is the top command. Top shows us the top processes that are using the most resources on our machine.

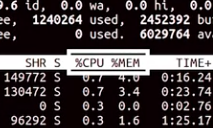
 One of the most common places to check when using the top command are these fields here, percentage CPU and percentage MEM. This shows what CPU and memory usage a single task is taking up.
 To get out of the top command, just hit the q key for quit.
A common situation you might encounter is when a user’s computer is running a little slow. It could be for lots of reasons, but one of the most common ones is the overuse of hardware resources. If you find that a top shows you a certain task is taking up a lot of memory or CPU, you should investigate what the process is doing. You might even terminate the process so that it gives back the resources it was using.
Another useful tool for resource utilization is the uptime command. This command shows information about the current time, how long your system’s been running, how many users are logged on, and what the load average of your machine is. From here, we can see the current time is 16:43 or 4:43.
 Our system has been up for 5 hours and 8 minutes, and we have one user logged in. The part that we want to talk about here is the system load average. This shows the average CPU load in one, 5, and 15 minute intervals.
Another command that you can use to help manage processes is the LSOF command.
Let’s say you have a USB drive connected to your machine. You’re working with some of the files on the machine. Then when you go to eject the USB drive, you get an error saying device or resource busy. You’ve already checked that none of the files on the USB drive are in use or opened anywhere or so you think. Using the LSOF command, you don’t have to wonder. It lists open files and what processes are using them. This command is great for tracking down those pesky processes that are holding open files.

Resource Monitoring in Linux
Balancing resources keeps a computer system running smoothly. When processes are using too many resources, operating problems may occur. To avoid problems from the overuse of resources, you should monitor the usage of resources. Monitoring resources and adjusting the balance is important to keep computers running at their best. This reading will cover how to monitor resources in Linux using the load average metric and the common command.
Load in Linux
In Linux, a load is the set of processes that a central processing unit (CPU) is currently running or waiting to run. A load for a system that is idle with no processes running or waiting to run is classified as a 0. Every process running or waiting to run adds a value of 1 to the load. This means if you have 3 applications running and 2 on the waitlist, the load is 5. The higher the load, the more resources are being used, and the more the load should be monitored to keep the system running smoothly.
Load average in Linux
The load as a measurement doesn’t provide much information as it constantly changes as processes run. To account for this, an average is used to measure the load on the system. The load average is calculated by finding the load over a given period of time. Linux uses three decimal values to show the load over time instead of the percent other systems use. An easy way to check the load average is to run the uptime command in the terminal. The following image depicts the load values returned from the uptime command.
$ uptime
 16:43:22 up  5:08,  1 user,  load average: 0.03, 0.03, 0.01
The command returns three load averages:
-
Average CPU load for last minute, which corresponds to 0.03. This is a very low value and means an average of 3% of the CPU was used over the last minute.
-
Average CPU load for last 5 minutes corresponds to the second value of 0.03. Again, this can be thought of as, on average, 3% of the CPU was being used over the past five minutes.
-
Average CPU load for last 15 minutes corresponds to 0.01, meaning on average, 1% of the CPU has been used over the last 15 minutes.
Top
Another way you can monitor the load average in Linux is to use the top (table of processes) command in the terminal. The result of running the top command is an in-depth view of the resources being used on your system.
top - 16:43:35 up  5:08,  1 user,  load average: 0.03, 0.03, 0.01
Tasks: 187 total,   1 running, 183 sleeping,   2 stopped,   1 zombie
%Cpu(s):  2.3 us,  0.7 sy,  0.0 ni, 96.8 id,  0.2 wa,  0.0 hi,  0.0 si,  0.0 st
MiB Mem :   7947.1 total,   4213.6 free,   1876.4 used,   1857.1 buff/cache
MiB Swap:   2048.0 total,   2048.0 free,      0.0 used.   5738.9 avail Mem

  PID USER      PR  NI    VIRT    RES    SHR S  %CPU  %MEM     TIME+ COMMAND
 1425 tyler     20   0 3021840 302144 104028 S   2.0   3.7   1:15.02 gnome-shell
  912 root      20   0  169456  12876   8452 S   0.3   0.2   0:04.11 sshd
The first line displayed is the same as the load average output given using the uptime command It lists what percent of the CPU is running processes or has processes waiting. The second line shows the task output and describes the status of processes in the system. The five states in the task output represent:
-
Total shows the sum of the processes from any state.
-
Running shows the number of processes currently handling requests, executing normally, and having CPU access.
-
Sleeping shows the number of processes awaiting resources in their normal state.
-
Stopped shows the number of processes ending and releasing resources. The stopped processes send a termination message to the parent process. The process created by the kernel in Linux is known as the “Parent Process.” All the processes derived from the parent process are termed as “Child Processes.”
-
Zombie shows the number of processes waiting for its parent process to release resources. Zombie processes usually mean an application or service didn’t exit gracefully. Having a few zombie processes is not a problem.
The top command gives detailed insight on usage for an IT individual to gauge the availability of resources on a system.
Key Takeaways
Computers need to balance the resources used with the resources that are free. Ensuring that the CPU is not overused means that a system will run with few issues.
-
The load in Linux is calculated by adding 1 for each process that is running or waiting to run.
-
Monitoring the average load of Linux allows an IT professional to identify which processes are running to determine what to end in order to balance the system. A balanced system runs with fewer problems than one that is using too high of a percent of resources.
-
The load average uses three time lengths to determine the use of the CPU: one minute, five minutes and fifteen minutes.
The top command can give detailed information about the resource usage of tasks that are running or waiting to run.